Ocean eDNA map: instruction |
|
| 24 Apr. 2025 |
|
Ocean eDNA map is software that analyzes species/ASV tables obtained from environmental DNA metabarcoding analysis to compare species distribution and biota. The database consists of species/ASV lists obtained from regions centered around the western North Pacific Ocean.
Users can,
1. investigate the distribution of species you're interested in.
2. upload a species/ASV list with individual counts/sequence numbers and compare species composition between sampling locations.
3. plot sampling locations on a map.
|

|
|
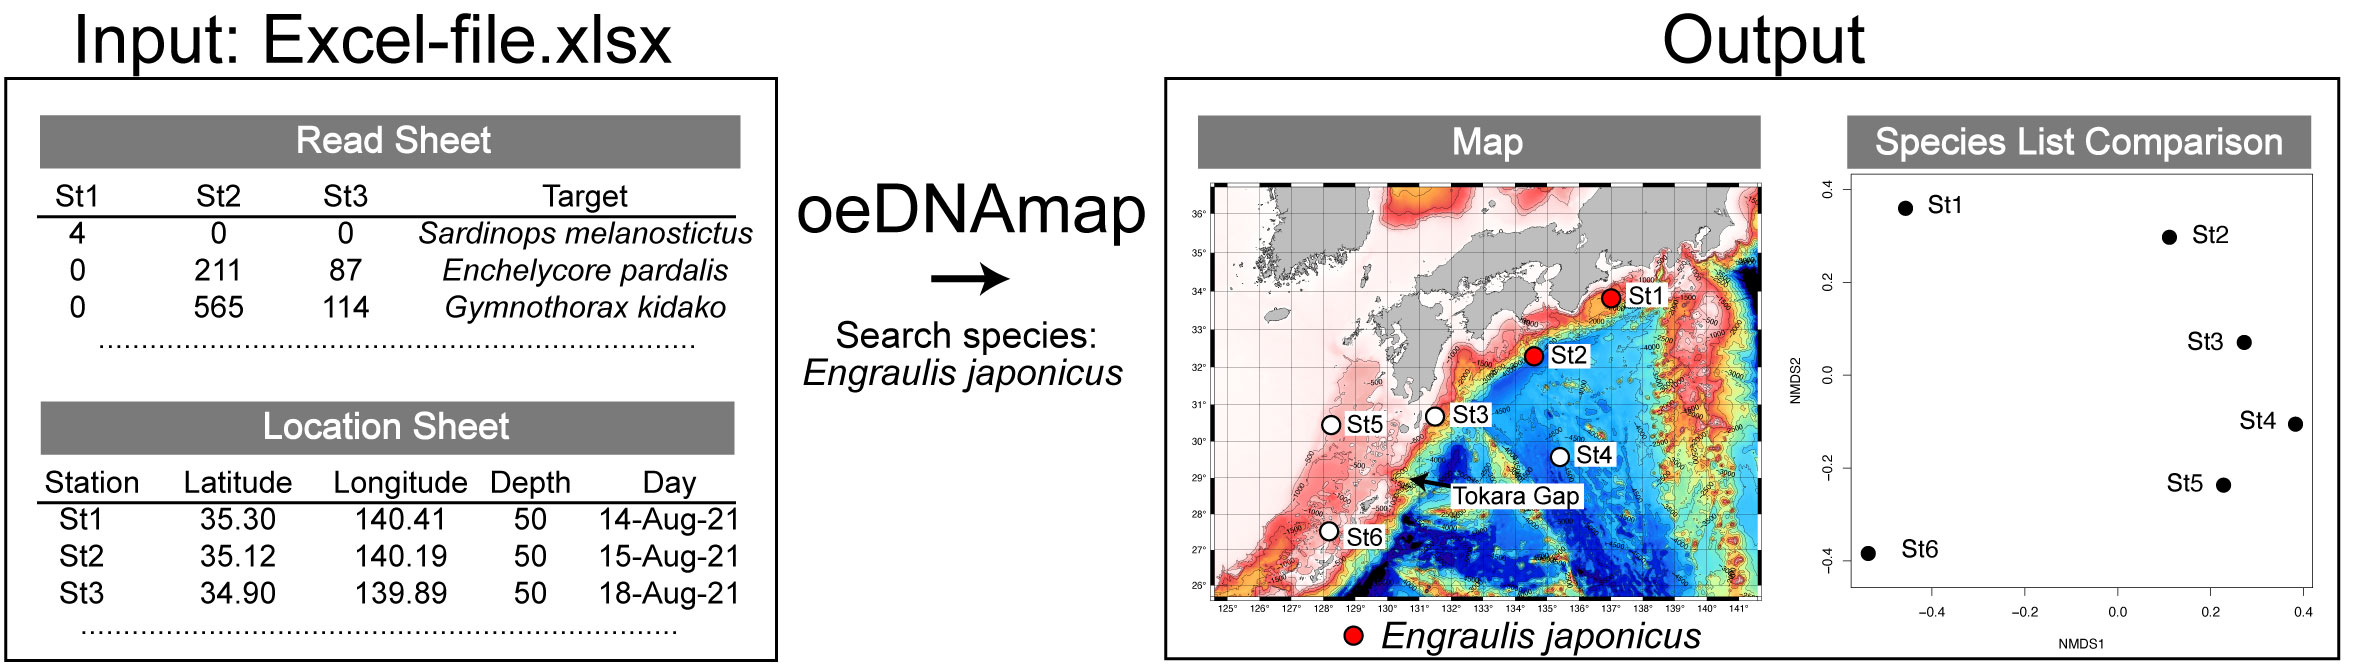
| As an example, we will upload and analyze the OUT_Miya22.xlsx file (Miya et al. 2022) obtained from the coastal waters of the Boso Peninsula. |
 |
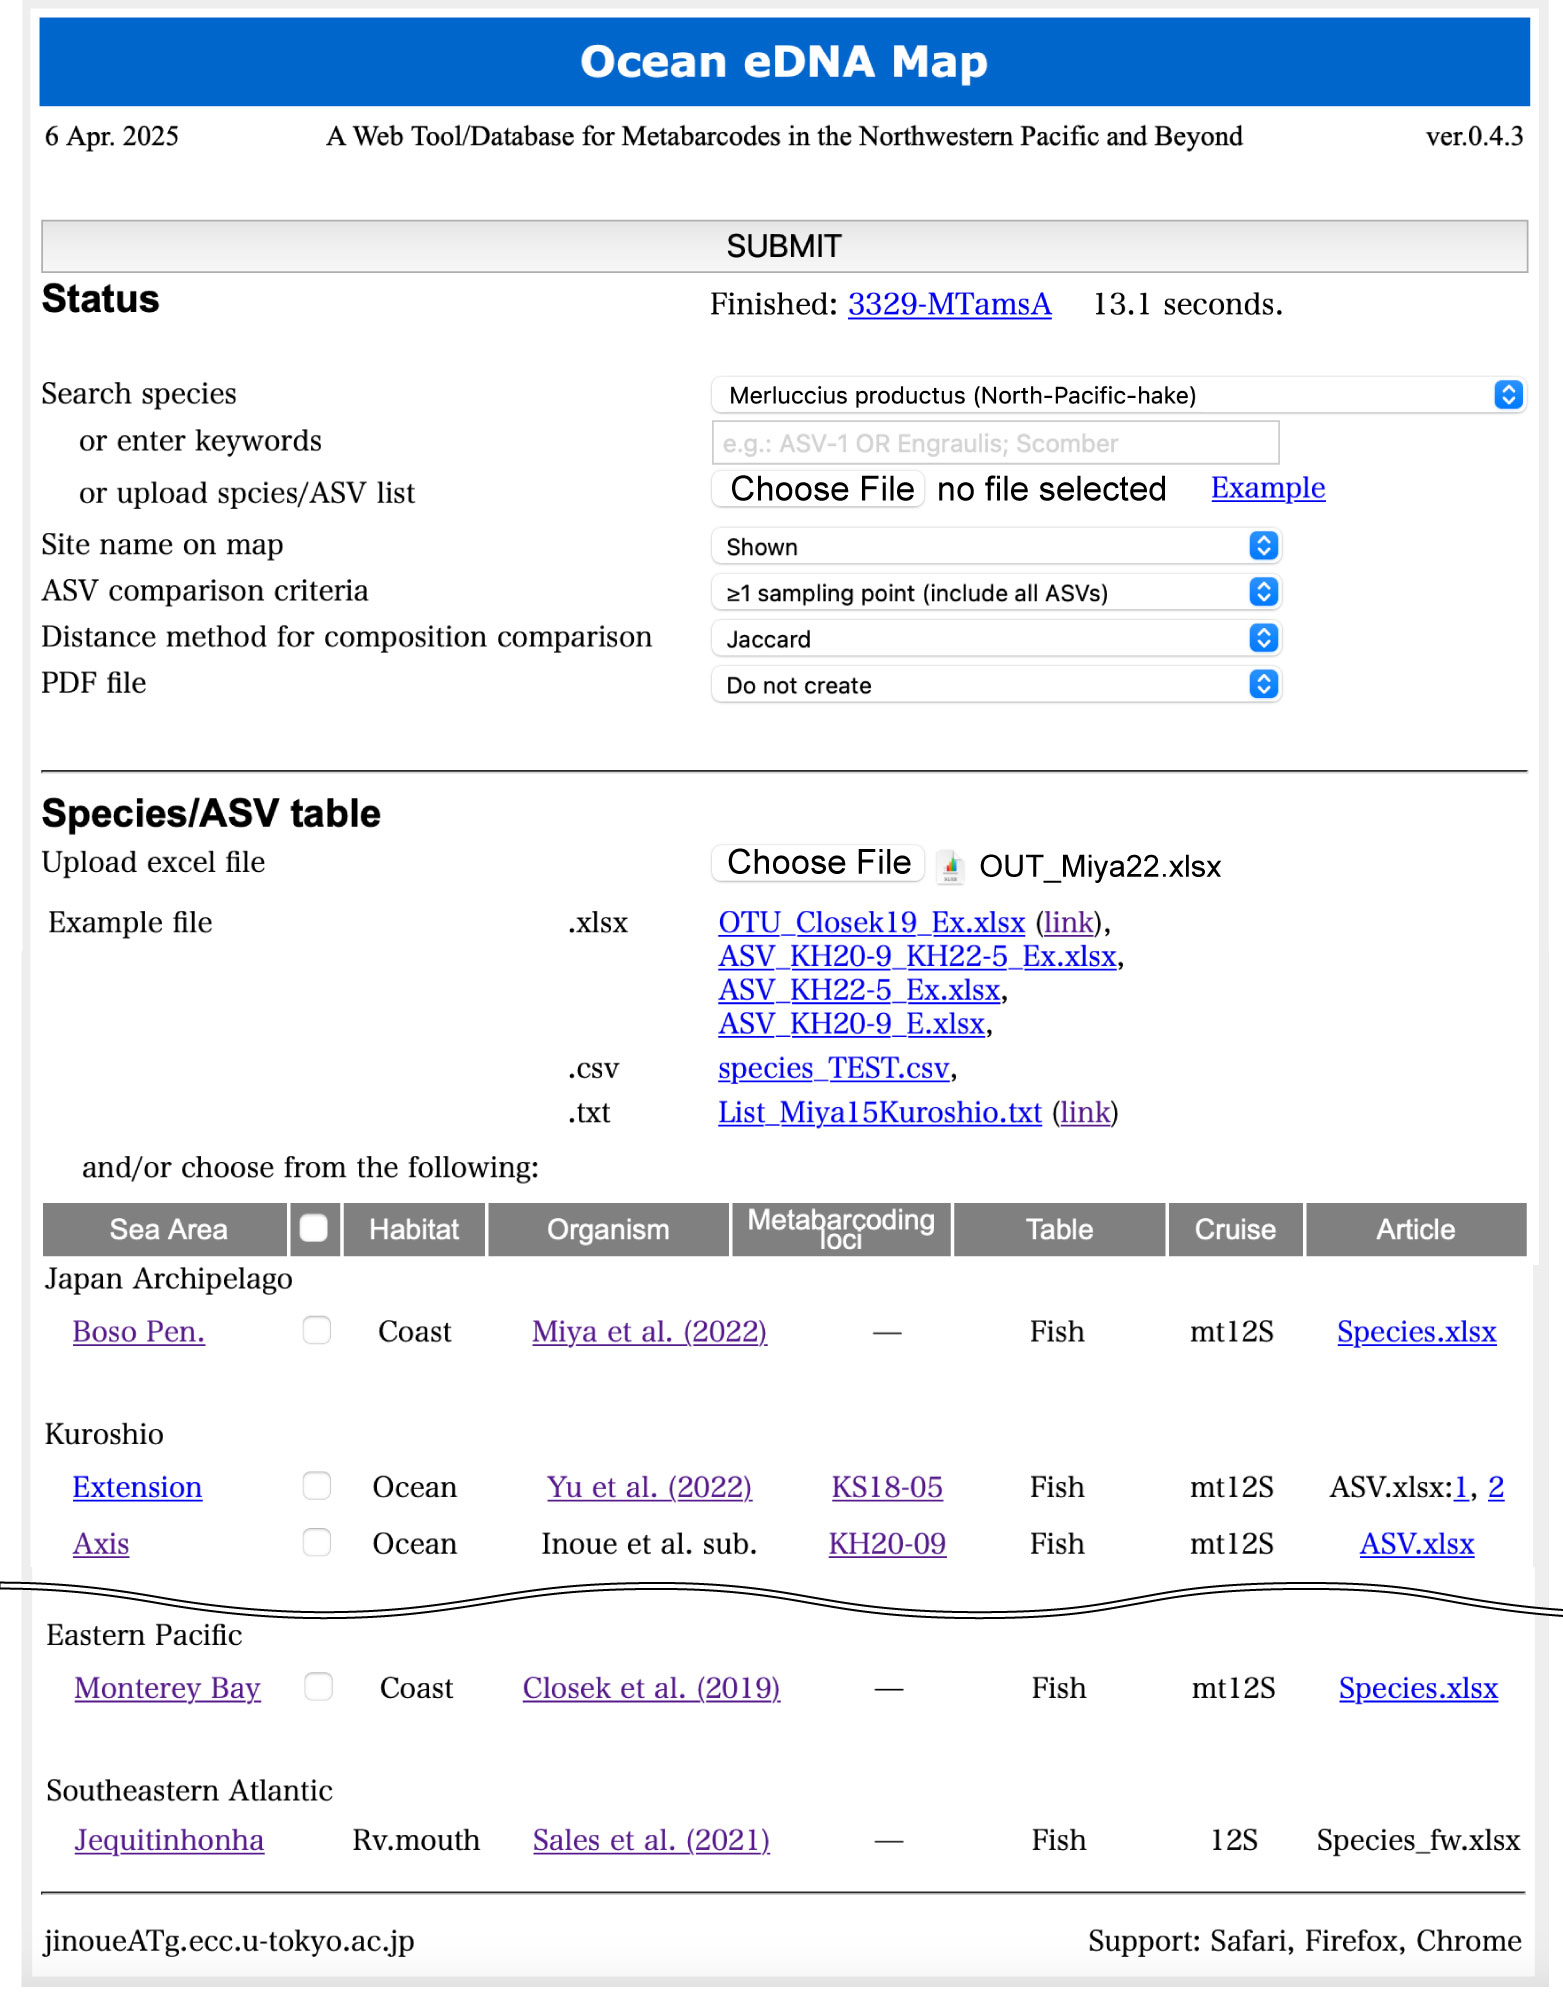
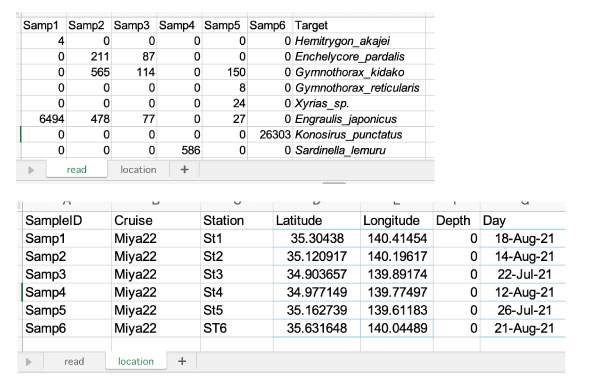
| The user uploads the OUT_Miya22.xlsx file, which consists of the Reads sheet and Location sheet (see below), from the "Species/ASV table > Upload excel file" option and then presses the SUBMIT button. |
Search species:
(1)
Search for the species name selected from the dropdown menu.
(2) Search for the keyword entered in the text box.
(3) Search by uploading a list of species names or ASV-IDs.
If an upload file is present (3), the search words from steps (1) and (2) will not be used. |
| Station name on map: Specify whether to plot the station names on the map. |
| ASV comparison criteria: Restrict the use of ASVs with few detection points when comparing species/ASV compositions among points for nMDS and cluster analysis. |
| Distance method for composition comparison: Specify whether to use the Jaccard or Bray-Curtis method as the distance measure when performing comparative analysis of species/ASV compositions among stations. For the Bray-Curtis method, the numbers in the ASV file must be written as percentages. |
| PDF file: You can choose whether to output the analysis results as PDF files. |
| Species/ASV table: Select already installed species/ASV tables for analysis. You can also compare them with the species/ASV table uploaded by the user. |
| |
| Input file: Enter the read and location information into the .xlsx file. |
 |
| |
| Outputs: Click the link next to "Status > Finished" to download. |
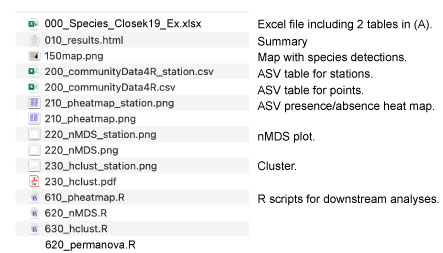 |
Users can independently perform PERMANOVA and environmental correlation analyses using various .R scripts downloaded as outputs. |
| |
|
Inoue et al. Ocean eDNA Map: A Metabarcoding Web Tool for Comparing Marine Biodiversity with Special Reference to Teleost Fish. submitted.
|
|
|
|